The Brexit scare is over. Or so it seems for domestic stock investors. Following a deep swoon in the wake of the UK vote, the S&P 500 and the Dow Jones Industrial Average have now notched new lifetime highs. Unexpectedly robust retail sales figures added "oomph" to the recovery, as did upbeat employment data and resurgent bank loan activity.
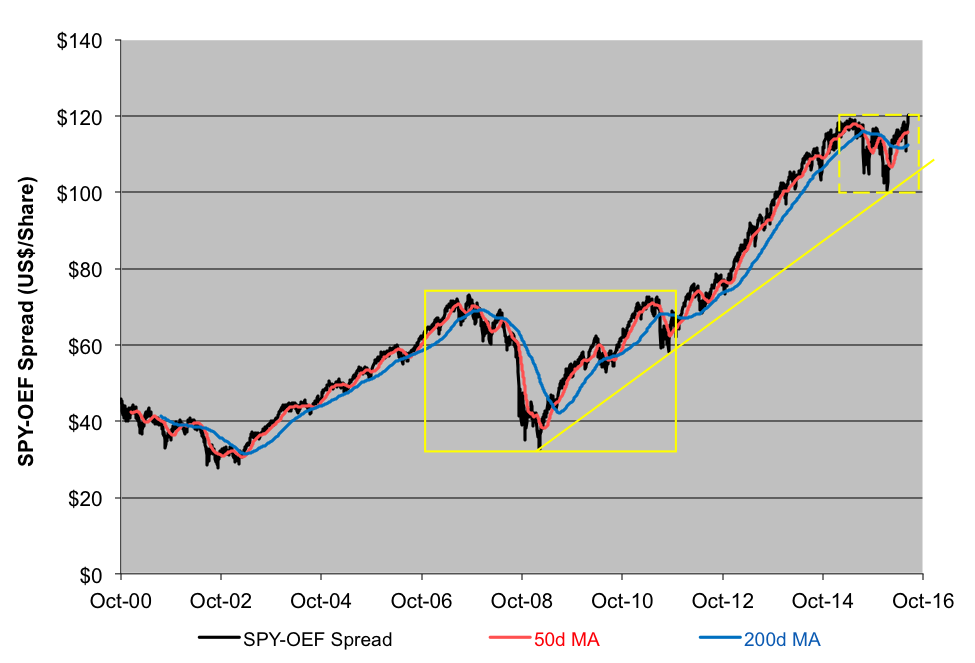
In sum, U.S. stocks look like a good bet again. One fairly reliable indicator of equity market trends is the spread between the share prices of the SPDR S&P 500 Trust (NYSE Arca: SPY) and the iShares S&P 100 ETF (NYSE Arca: OEF). SPY, while classified as a large-cap portfolio, in fact, holds a dollop of medium- and small-sized companies. OEF, on the other hand, holds the bluest of the S&P 500's blue chips; it's made up solely of mega- and large-cap issues. Investors tend to favor larger-cap companies when they're defensive; in more expansive moods, they venture down the capitalization ladder.
Presently, SPY is trading at a $120 per share premium over OEF - another lifetime high.
If you trace SPY's premium over OEF, you get a sense of the bullishness among blue chip investors. The interplay of the spread's moving averages, in particular, is a fairly reliable indicator of trend changes.
Presently, the spread's at the $120 level and breaking out of a year-long consolidation period. A "bullish cross" of the 50-day moving average over the 200-day marker presaged the current rally and held up through the Brexit scare. Technically, that sets up $128 as an objective.
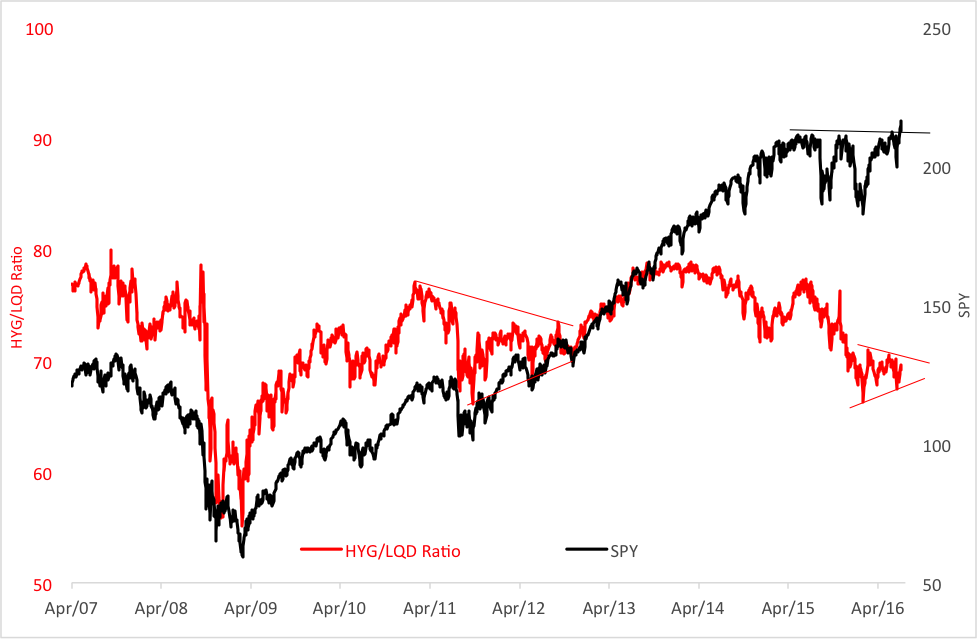
There's another chart, though, that may make investors second-guess the bullish breakout. It's the one that tracks the ratio of the iShares iBoxx $ High Yield Corporate Bond ETF (NYSE Arca: HYG) to its sibling, the iShares iBoxx $ Investment Grade Corporate Bond ETF (NYSE Arca: LQD).
Generally, the junk bond ratio keeps pace with the stock market, but it can often warn of impending stalls in equity momentum. The ratio has pointed to bullish overextensions in the past (see the chart below) and now, with a pennant flag formation, points to another breakout for stocks. This time, though, the ratio's in decline. A pennant is a continuation pattern, meaning technicians are now more likely to wager on further weakness in the ratio.
So what should stock investors do? Just this: Keep an eye on the HYG/LQD ratio to see its ultimate breakout direction. Once established, you can then adjust your stock positions accordingly.
Brad Zigler is WealthManagement's Alternative Investments Editor. Previously, he was the head of Marketing, Research and Education for the Pacific Exchange's (now NYSE Arca) option market and the iShares complex of exchange traded funds.


